
.gif)
Key Takeaways
- Monitor wait times to ensure guests don't have to wait more than 30-45 minutes, as longer waits risk losing customers permanently. An efficient guest management system can help calculate and optimize wait times.
- Track restaurant revenue per seat to understand your earning potential when fully occupied. This metric, along with average spend per customer, allows you to forecast sales and develop strategies to boost revenues.
- Analyze table turn times - the duration guests occupy a table. For quick-service and casual dining, faster turns are ideal, but fine dining may prioritize a more leisurely experience. Optimizing turn times based on your model enhances the overall customer experience.
- Identify best and least popular menu items using historical data. Highlight top sellers prominently on menus, and consider removing underperforming dishes to streamline offerings.
Restaurants worldwide are facing rigorous competition that owners must deal with. The success of restaurants lies in their ability to know who their customers are, what do they want and if they are being able to deliver in an optimal way.
A good strategy is to monitor, track and evaluate the metrics that affect the diner's experience at the restaurant. By doing this regularly, restaurant owners can detect the trends that are negatively impacting the reputation and revenue of the restaurant. Here are a few restaurant metrics to pay attention to.
Waiting Time
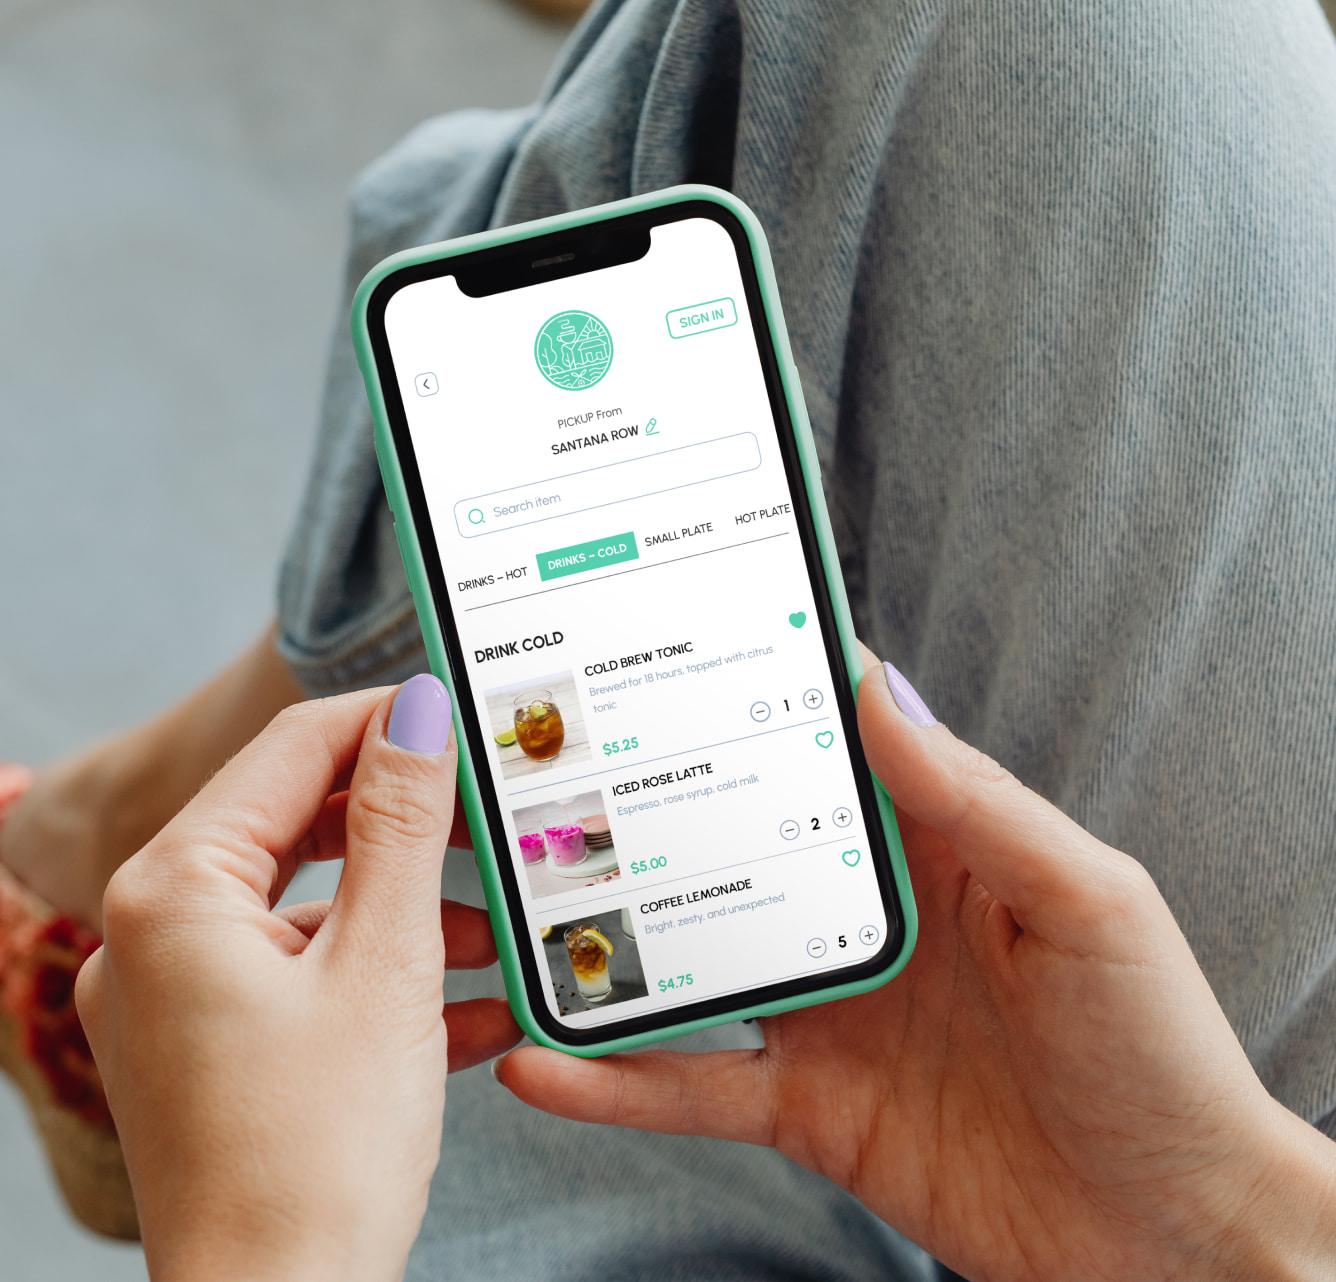
How long people have to wait until they get a table? 15 minutes? 30 minutes? 45 minutes? Anything between 15-30 minutes is good. 30-45 minutes is acceptable. Anything beyond 45 minutes means that your guest is going to walk away and you end up losing a customer for a very long time, if not permanently. An efficient guest management system will automatically calculate the wait times based on the reservation bookings, table statuses, waitlist, and historical data.
Restaurant Revenue Per Seat
What is the average amount a single customer spends at your restaurant? What is the average spending per table? Based on this metric calculation, you'll have a better understanding of your restaurant's potential earning when all seats are taken. You can also use Average Cover Metric to predict and forecast future sales. Using Restaurant Revenue per Seat metric is a surefire way to boost revenues with informed strategies.
Table Turn Time
A table turnover or table turn time calculates the time that a guest spends at the restaurant - from the time they take the seat to the time they leave. When it comes to QSRs or casual dining establishments, the faster the table turn during a specific time period, the better it is for the business. The same may not hold true for fine dining establishments and the ones that serve alcohol.
Based on your business model, having a thick count of your average table turn will highlight the factors contributing to a great table turnover and the ones that need improvement. This, in turn, will help you enhance the overall customer experience.
Best/least Performing Dishes
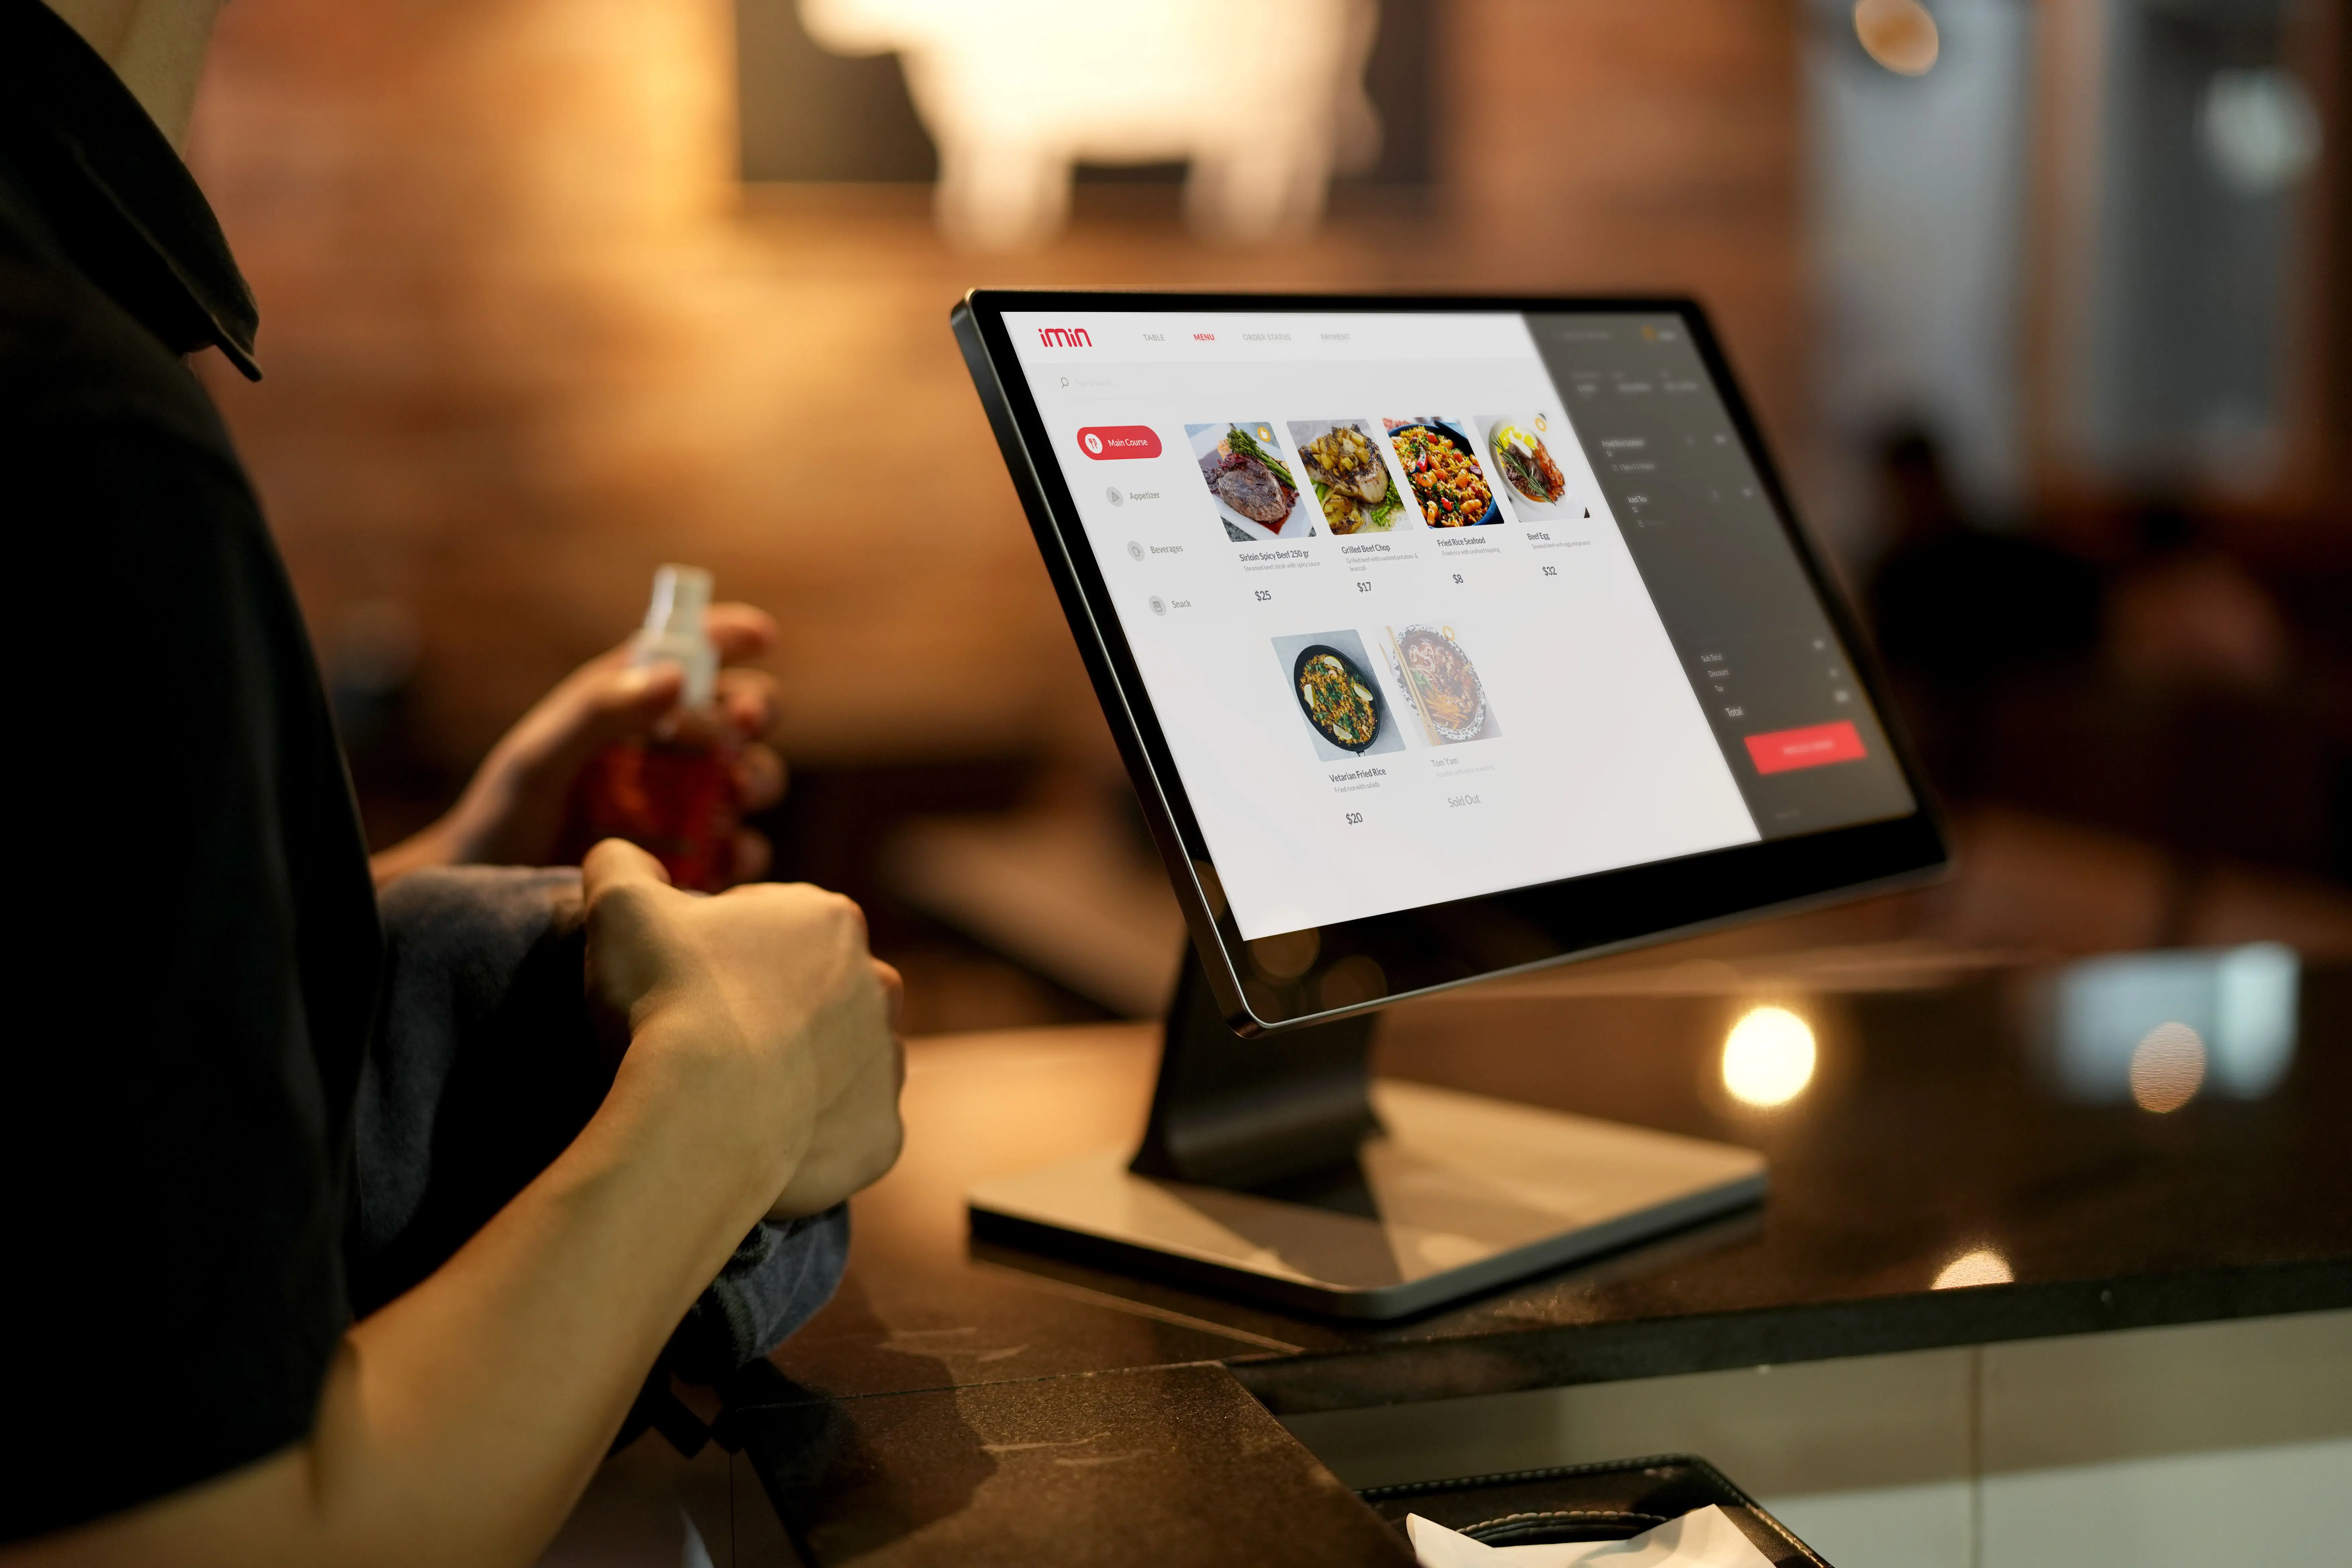
What do your customers like to order the most and which dishes are better off the menu? For restaurants, whether a fast food chain or a multi-cuisine establishment, creating a great menu can be a daunting task. But if you have access to the historical data and reports highlighting the popular dishes. You can either put them in the first few pages of the menu or highlight them under "Most Popular" category. In addition, you can identify the least popular dishes and eliminate them.
Employee Turnover Rate
The most important, yet the most neglected one. According to United States Bureau of Labor Statistics, in 2016, The annual employee turnover rates in the restaurant sector was more than 70%. Such a high percentage of employee turnover for any fast-paced service company is a hefty financial burden that most restaurants can’t afford to shoulder. By routinely monitoring your restaurant's employee turnover rate you can identify the historical trends and set yourself up for future growth.
Conclusion
Tracking data at your restaurant is an efficient way to boost the bottom line. In order to gain true business insight and value from these metrics, restaurant owners should monitor and analyze these on a weekly or monthly basis.

Team Restolabs is a group of hospitality tech experts, strategists, and innovators dedicated to helping restaurants thrive in the digital age. With deep expertise in branding, growth, product development, and restaurant technology, we provide insights on scaling, streamlining operations, and enhancing customer experience.
Frequently Asked Questions
Monitoring key performance metrics allows you to detect trends that may be negatively impacting your restaurant's reputation and revenue. By analyzing these metrics regularly, you can identify areas for improvement and make data-driven decisions to enhance the overall customer experience.
For quick-service or casual dining restaurants, a faster table turn time during peak hours is better for business. However, fine dining establishments may aim for a slower pace. Analyze your average table turn time to pinpoint factors contributing to an optimal turnover rate.
Track which dishes are most and least popular among customers. Highlight top sellers on the first few menu pages or under a "Most Popular" section. For underperforming dishes, consider removing them from the menu to streamline offerings.
The restaurant industry has notoriously high employee turnover rates, which can be costly. By routinely tracking this metric, you can identify trends and take steps to improve retention, ultimately reducing hiring and training expenses.
To gain valuable insights, it's recommended to monitor and analyze key metrics like wait times, revenue per seat, table turns, dish performance, and employee turnover on a weekly or monthly basis.
.jpg)
.jpg)


.webp)

.svg)
.webp)